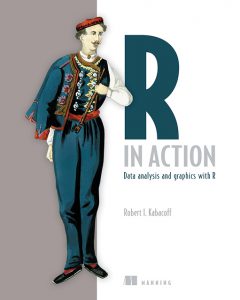
R in action : data analysis and graphics with R and Tidyverse
CALL NO QA276.45.R3 K11r 2022
IMPRINT Shelter Island, NY : Manning Publications Co., c2022
[For MU Students and Staff can request here]
R is the most powerful tool you can use for statistical analysis. This definitive guide smooths R’s steep learning curve with practical solutions and real-world applications for commercial environments.
In R in Action, Third Edition you will learn how to:
- Set up and install R and RStudio
- Clean, manage, and analyze data with R
- Use the ggplot2 package for graphs and visualizations
- Solve data management problems using R functions
- Fit and interpret regression models
- Test hypotheses and estimate confidence
- Simplify complex multivariate data with principal components and exploratory factor analysis
- Make predictions using time series forecasting
- Create dynamic reports and stunning visualizations
- Techniques for debugging programs and creating packages
R in Action, Third Edition makes learning R quick and easy. That’s why thousands of data scientists have chosen this guide to help them master the powerful language. Far from being a dry academic tome, every example you’ll encounter in this book is relevant to scientific and business developers, and helps you solve common data challenges. R expert Rob Kabacoff takes you on a crash course in statistics, from dealing with messy and incomplete data to creating stunning visualizations. This revised and expanded third edition contains fresh coverage of the new tidyverse approach to data analysis and R’s state-of-the-art graphing capabilities with the ggplot2 package.
SOURCE : https://www.manning.com/books/r-in-action-third-edition


